Organic food supply chains?
Ever wondered what a modern organic food supply chain looks like? Me too, So I did some research.
I looked across the U.S, U.K and Japan. I discovered three main models:
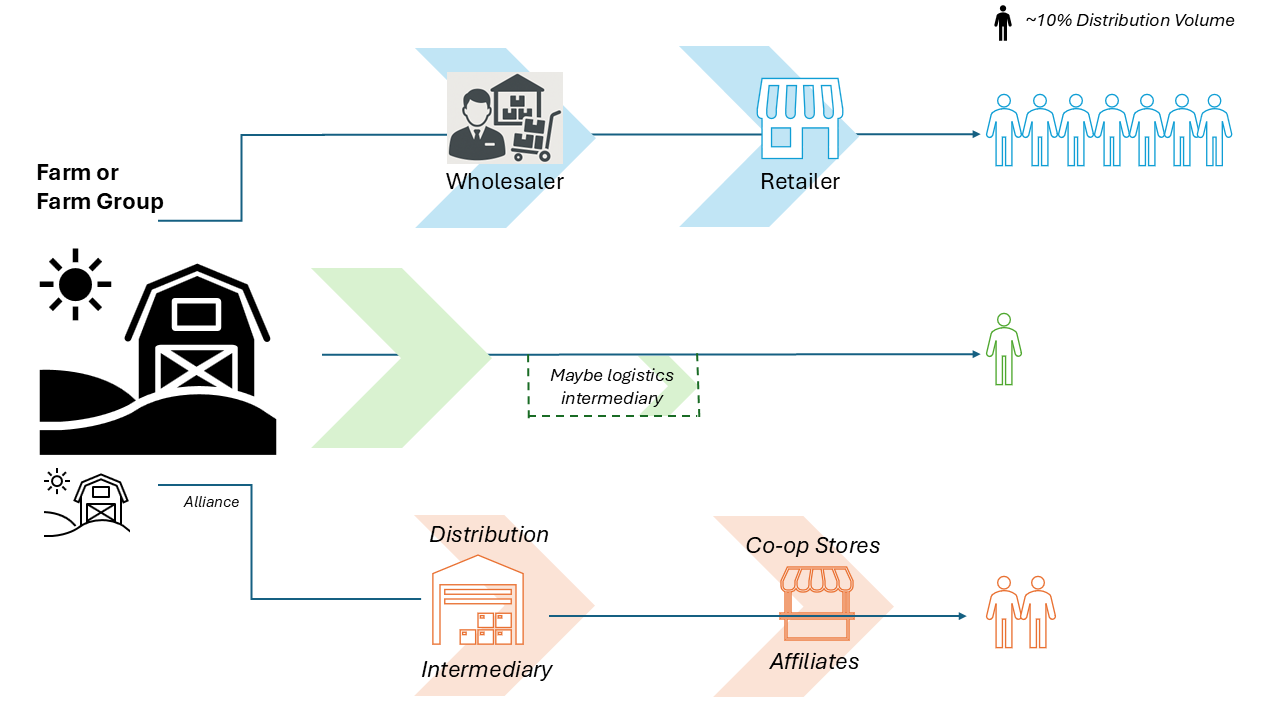
Figure 1 – Three volumetrically different supply chains consumers can source organic produce
Meet our first model – Direct to household - (figure 1 – Green pathway)
An organic farm or small farm group supplies organic produce direct to consumer. Either through delivery or an intermediary.
This model is prevalent, healthy and rising in Japan (3) the UK (2) and the U.S (1). A new, relatively “niche” model.
In this model, occasionally, a “boxing company” can act as an intermediary to manage distribution by aggregating and branding produce into a customized box.
In all three countries this model supplies <10% of consumers (3) (1,9). Supplying slightly higher proportions in the U.K (5). The “box company” variant in the U.K supplies <20% of consumers (5).
Traditional organic supply chain - (figure 1 – Blue pathway) - Our second model
A typical organic supply chain you would be most familiar with.
Organic produce is farm grown, sent to a wholesaler for distribution management, distributed to retailers, ending in the home.
This model is most prominent in the U.S (9).
In Japan and the U.K it is less prevalent (5)(3).
In all countries this supply chain is most likely to affect and influence your organic produce and product derivatives.
Supplies an estimated 88% of consumers (9) in the U.S, ~66% in the U.K (5), ~85% in Japan.
Alliance or Co-op Model - (figure 1 – Orange pathway) - Our third model
A popular, growing supply chain model.
An alliance or co-op network actively builds and manages a producer (farm) network. Can be thought of, in some respects as a hybrid of model 1 and 2. Can include emerging blockchain technologies.
This model in all three countries, is growing, having significant presence in both Japan (17) and the U.K (21). Co-ops are relatively smaller in the U.S but very dense in organic share.
—————————————————————————————————————————————————————————————————————————
Across all models, a consumer in all countries has roughly a 10:70:20 split respectively (model 1: model 2: model 3) of being impacted by a given supply chain when consuming organic produce.
Any given organic produce item will have significantly different points of contact across supply chains, with growing variance.
In short, consumer choices matter and supplier choices matter.
What technologies help visualize our supply chains?
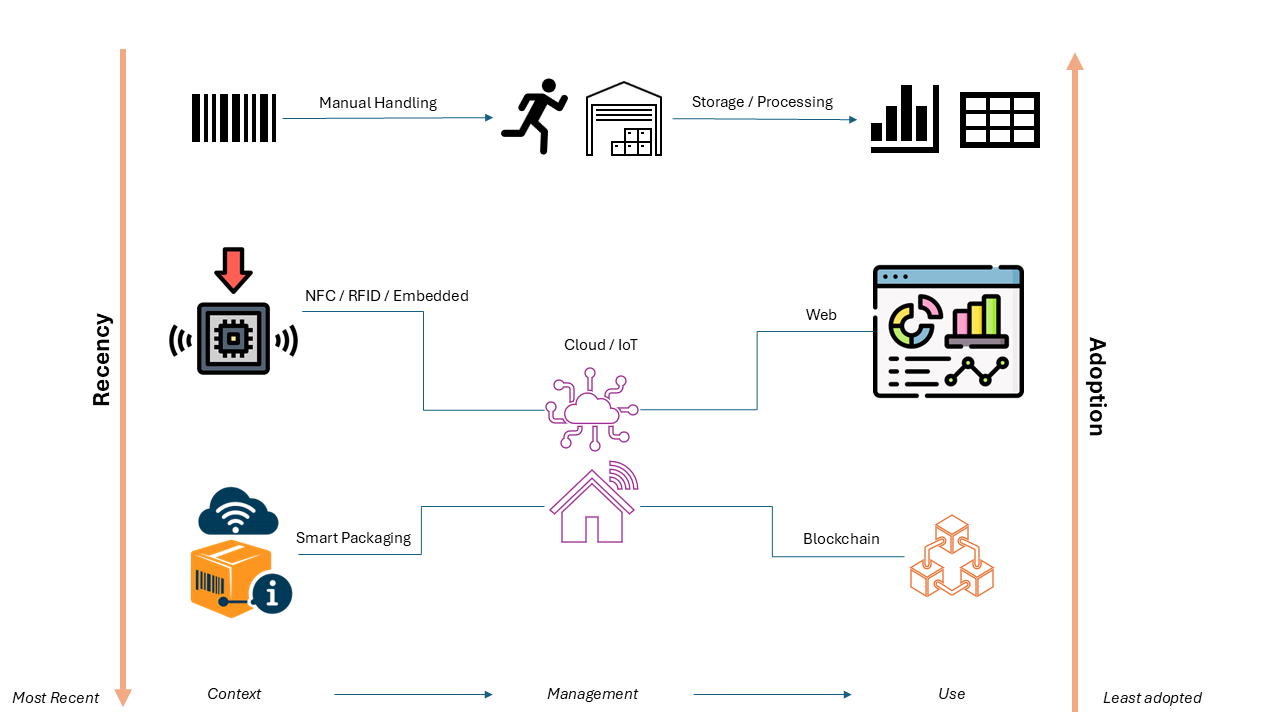
Figure 2 - Some technologies which help visualize the supply chain. Least recent most adopted at the top, most recent least adopted at the bottom.
In western markets, most supermarkets and retailers have barcode tracking and temperature logging (~70-90%). Some (~15-30%) have real-time monitoring (IoT, cold chain monitoring, control towers). Advanced blockchain traceability, ambient IoT tags and smart packaging are in less than 5% of distributed produce.
In Japan, proportions are quite similar. The only measurable difference I could find being a rapid uptake of cold-chain monitoring solutions (IoT). AI and blockchain technologies across cold-chain solutions is also increasing in Japan.
Most emerging technologies leverage IoT and sensors which feed back into the cloud. Either through manual node handling or pseudo-real time monitoring. Providing rich dashboard knowledge.
To summarize, modern supply chain visibility depends on cloud integration. The way companies’ source and use cloud data determines visibility. Given the significant variance associated with produce, and current low levels of technical adoption, we have a long way to go toward an ideal stack that visualizes this problem and even further to go toward informing the consumer about how their choices are impacted.
Current issues associated with limited supply chain visibility?
When companies have limited or no visibility across their supply chain, they have a lesser understanding of quality delivered to customers (26)(27).
For organic produce quality means better consumer health and a better product.
Consider the scenario below:
Imagine walking into a supermarket, you want to buy an orange, you have three choices.
Supplier A has strong visibility, B, average, C, none.
Let’s simplify variables affecting this scenario, shown in figure 3, below.

3) A heavily simplified set of variables implicated in supply chain delivery of oranges. Arbitrary probabilities.
4) An estimate of the probabilities associated with scenario in figure 3 for any given consumer to consume the best quality orange, the lowest quality orange, and an unsafe orange.
Whilst there are many factors that producers and suppliers differ on, this scenario highlights two, soil variability and genetic variance.
Let’s assume suppliers use different soils and grow different genetic variants.
The percentage next to soil variability (20%) means there is a 20% chance of choosing the best orange from supplier A when you purchase an orange associated with the best soil variant.
If supplier A also uses 3 different genetic groups, then you may also say that within that 20% is another group at 20/3 = 6.7% chance of choosing the best orange associated with the best soil + genetic variant.
Meaning that if we only take these two factors supplier A has 5 * 3 = 15 orange variants. Purposeful or not.
Now extrapolate this logic across all the suppliers in the table (hypothetical probabilities).
The upper quality band for supplier A is calculated by (20% * 50%) / 3. Meaning there is a 3.33% chance, when no contamination or supply chain incident occurs, that consumers choose the highest quality variant.
Upper Quality Variant - (20% * 50%) / 3 = 3.33% chance
Lower Quality Variant - (20% * 50%) / 3 = 3.33% chance
Unsafe Quality Variant - (20% * 50% * 10% * 1%) / 3 = 0.0033% chance
I want to highlight here that suppliers’ choices affect this band, heavily. You as a consumer necessarily onboard the risk profile associated with these choices.
Consider also the worst unsafe scenario, very low in each case.
How many weeks does it take for this to become a reality for a consumer?
We would expect the worst unsafe variant to occur (per consumer) after:
Option A - (1/0.000033)/52 = 582 years
Option B - (1/0.000025)/52 = 769 years
Option C - (1/0.000055)/52 = 349 years
Great that’s out of our lifetimes nothing to worry about. Wrong. Our frequency of consumption also matters. We can simply divide the number of years above by the frequency we consume in a week.
Option A - 582 years / 5 per week = 116 years
Option B - 769 years / 5 per week = 153 years
Option C - 349 years / 5 per week = 70 years
From the above, you may be able to see how simply two consumer choices; weekly purchase frequency and weekly consumption rate affect our scenario. Ponder this in light of the preference for highest quality produce in each case. Consumer choices matter.
A supplier or distributor with no supply chain visibility, particularly in organic produce will struggle to regulate the quality of their produce and necessarily accept a larger normally distributed variance. Meaning the time it takes for you to consume low quality or unsafe food is reduced.
Figure 5 summarizes this concept in better detail:
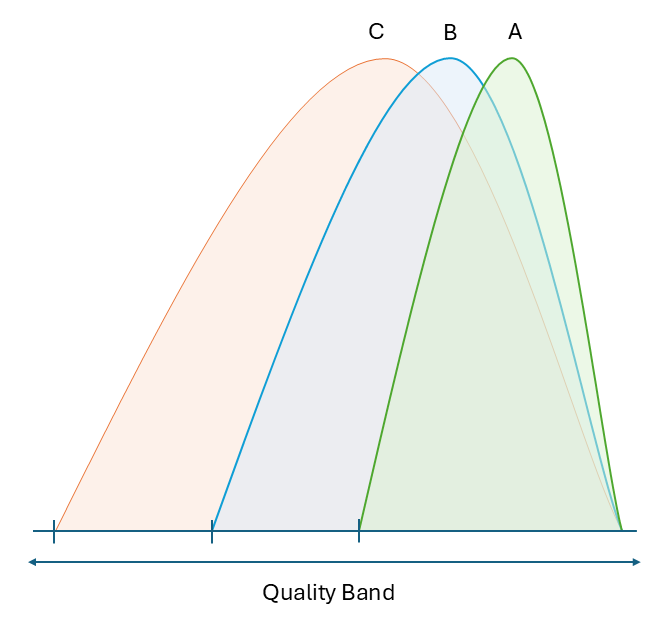
Figure 5 - Supply chain visibility reduces the width of the quality band consumers absorb. In our example, supplier A had the best visibility.
Supplier C (no visibility) has the widest and most temporally affected band because they have no feedback. Completely exposed, no visibility.
Supplier B with some visibility can mitigate the effects of some variables, but not all, having a mid-tier band.
Supplier A, with the most visibility can manage and optimize for produce quality.
A better supplier significantly reduces the size of these bands, a smaller band, means healthier consumers. More visibility means more control.
To summarize, we have explored three main organic supply chain methods. Discovered that consumers source their produce variably and different supply chains have significantly different contact pathways for organic produce. This means consumer choices matter, and grower choices matter.
To inform consumers and businesses, the supply chain must be understood and visualized. Today widely adopted technologies are not enough to visualize the supply chain to maximize potential. IoT, blockchain and innovative cloud technologies should be adopted. Realizing the potential of AI in the nutritional space, might just depend on these technologies.
Adopting these technologies allow suppliers to minimize the quality band that consumers onboard, intervening when necessary.
“Supply chain visibility maps to food quality, better food quality means healthier consumers”
株式会社TiviTi is an engineering company using emerging technologies to help solve emerging problems. We hope to help companies visualize the supply chain to improve the quality of food they distribute.
Sincerely,
株式会社TiviTi
References
(1) United States Department of Agriculture, National Agricultural Library. (n.d.). Community supported agriculture (CSA). USDA National Agricultural Library. https://www.nal.usda.gov/farms-and-agricultural-production-systems/community-supported-agriculture National Agricultural Library
(2) Organic Research Centre. (2024, February 28). The Organic Market Report 2024. Organic Research Centre / Soil Association Certification. https://www.organicresearchcentre.com/news-events/news/organic-market-report-2024/ The Organic Research Centre+1
(3) Ministry of Agriculture, Forestry and Fisheries (MAFF). (2025, September). The situation surrounding organic agriculture in Japan (2025.09). Government of Japan. https://www.maff.go.jp/e/policies/env/sustainagri/TheSituationSurroundingOrganicAgricultureinJapan_2025.09.pdf Ministry of Agriculture+1
(5) Soil Association. (2024, February 22). Organic market grows for 12th year – but the UK needs “radical rethink” to reap further benefits. Soil Association. https://www.soilassociation.org/news/2024/february/22/organic-market-grows-for-12th-year-but-the-uk-needs-radical-rethink-to-reap-further-benefits/ Soil Association+1
(6) Misfits Market. (n.d.). Grocery delivery: Fresh organic produce and more. Misfits Market. https://www.misfitsmarket.com/ Misfits Market+1
(7) Riverford Organic Farmers. (n.d.). Organic veg boxes. Riverford. https://www.riverford.co.uk/seasonal-organic-boxes/organic-veg-boxes Riverford Organic Farmers+1
(8) Oisix ra daichi Inc. (n.d.). Company overview and business model. Shared Research report on Oisix ra daichi Inc. https://sharedresearch.jp/en/companies/3182/report/63c8d8ccd07db000135378bb Shared Research+1
(9) Coherent Market Insights. (2025, May 23). Sweet sauces market size and share analysis – growth trends and forecasts (2025–2032). Coherent Market Insights. https://www.coherentmarketinsights.com/industry-reports/sweet-sauces-market Coherent Market Insights
(11) United Natural Foods, Inc. (UNFI). (n.d.). Organic, natural and conventional food distribution. UNFI. https://www.unfi.com/ UNFI+2UNFI+2
(12) Langridge Organic Products. (n.d.). Langridge Organic: Organic wholesale and seasonal produce. Langridge Organic. https://langridgeorganic.com/ Langridge Organic Products Ltd+2Langridge Organic Products Ltd+2
(15) Grimmway Farms. (2021, April 28). Grimmway Farms has 25+ years of organic excellence. Organic Produce Network / Grimmway Farms Newsroom. https://www.organicproducenetwork.com/organic-growers/grimmway-farms-has-25-years-of-organic-excellence Organic Produce Network+1
(17) Aeon Co., Ltd. (2022). Aeon report 2022: Sustainability edition. Aeon Sustainability Report. https://www.aeon.info/en/wp-content/uploads/sustainability/images/report/2022/c-p126_sustainability_all_20230213_webguard.pdf Aeon+1
(20) National Co+op Grocers (NCG). (2024). NCG Food Co-op Impact Report 2024. National Co+op Grocers. https://www.ncg.coop/sites/default/files/documents/NCG_Food_Co-op_Impact_Report_2024_Public.pdf Partner Connection+1
(21) Butler, S. (2025, April 3). Co-op to open at least 120 more grocery shops after profits rise five-fold. The Guardian. https://www.theguardian.com/business/2025/apr/03/co-op-to-open-at-least-120-more-grocery-shops-after-profits-rise-five-fold The Guardian+1
(26) Liu, Y., & Jiang, Y. (2025). The impact of supply chain quality management on firm performance in manufacturing business: The moderating role of digital intelligence. Sustainability, 17(9), 4165. https://doi.org/10.3390/su17094165 MDPI+1
(27) Ministry of Economy, Trade and Industry (METI). (2021). International economic growth strategy integrating domestic and overseas initiatives (FY2021 report). (Includes analysis by Boston Consulting Group on supply chain visibility and forecasting accuracy). https://www.meti.go.jp/meti_lib/report/2021FY/000667.pdf Ministry of Economy, Trade and Industry